Urban3 utilizes the available historical redlining maps to analyze and visualize the long-term economic impact on property values and neighborhood fiscal health within your community. Additionally, we can quantify and visualize the lost value, and the potential future value of reinvestment in red and yellow lined neighborhoods.
- Outcomes in terms of race correlate with where redlining was done.
- Vacant lots show potential tax revenue that’s been lost where people used to live.
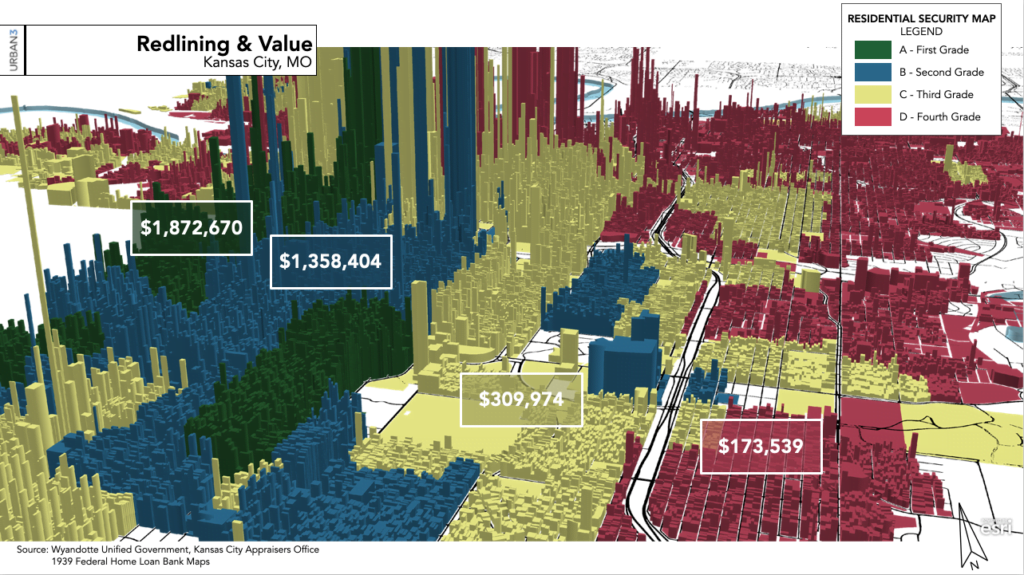
- The correlation of outcomes of property values and grading in 1939 has created the “stairstep” effect.
- Even in redlining areas, people have managed to maintain their value.
See an example of a Redlining and vacancy Analysis for the City of South Bend, IN here.